
Industrial wastewater conditions can change with production load and process operations. Periodic sampling may identify whether a sample meets requirements, but it cannot continuously show how wastewater conditions are changing between sampling intervals.
In two industrial applications—a cement plant and a textile dyeing plant—online water quality monitoring was used to create a more direct operating chain:
Continuous Wastewater Data → Treatment Status Assessment → Dosing / Oxidation Adjustment → Final Effluent Control
The projects show how water quality data can support both discharge monitoring and day-to-day wastewater treatment decisions.
Why Continuous Industrial Wastewater Data Matters?
At the cement plant, wastewater showed pH fluctuations and specific chemical contaminants. The previous approach relied mainly on manual sampling, creating delays between a water quality change and an operational response.
The monitoring system introduced online pH, COD and ammonia nitrogen measurement at key influent and effluent points. Data was continuously transmitted to the central control platform, where abnormal values could trigger alarms.
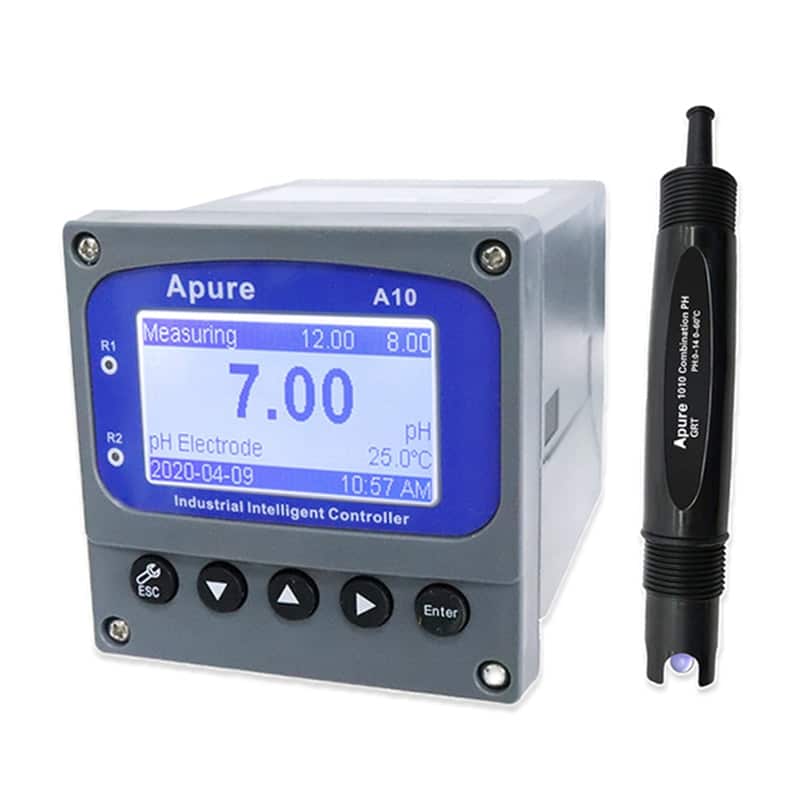
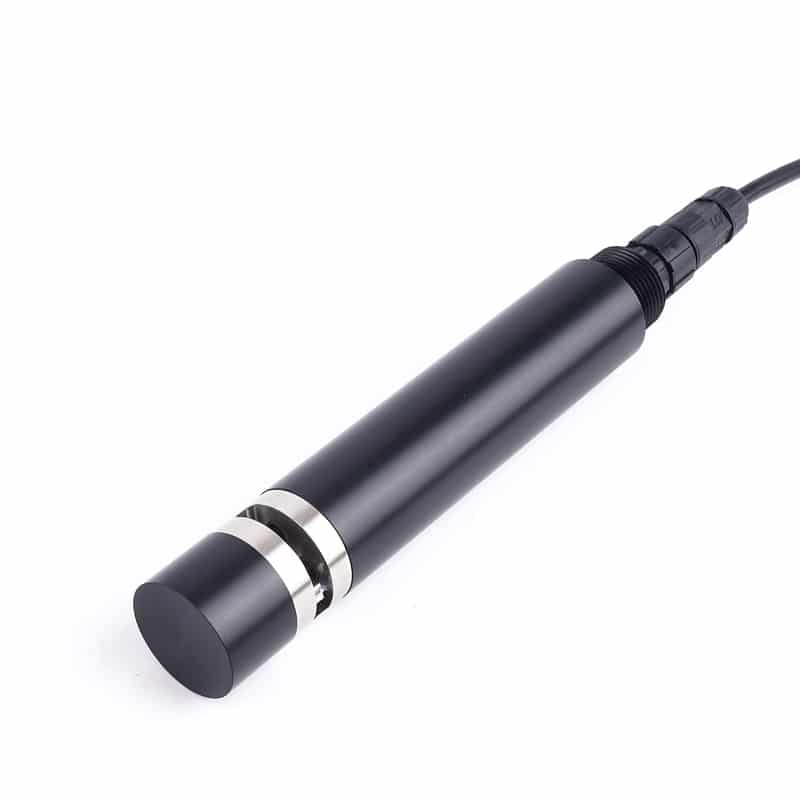
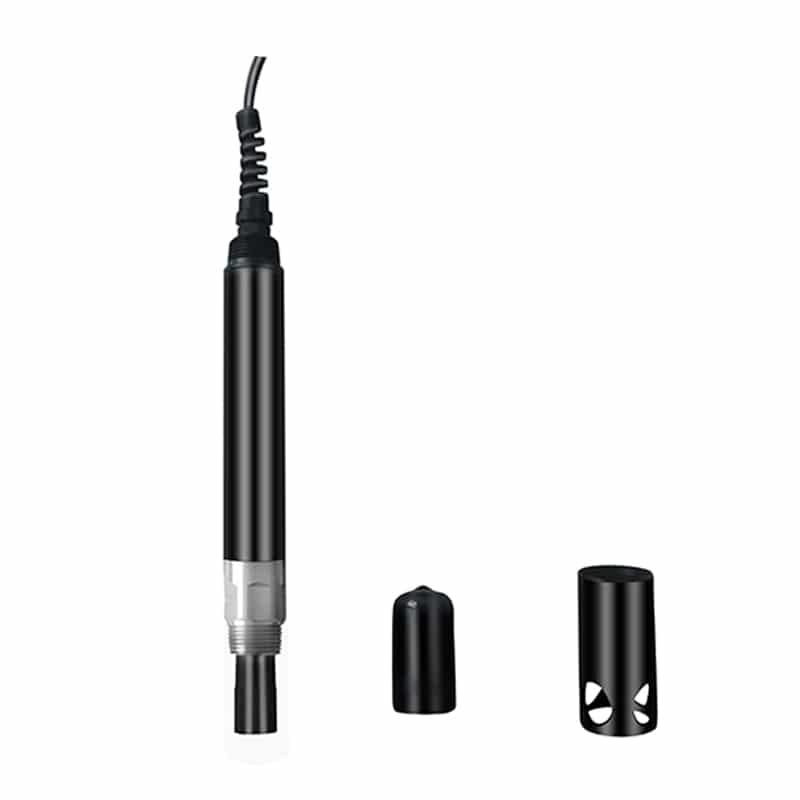
According to the project operating results, continuous monitoring helped maintain key pH, COD and ammonia nitrogen indicators in compliance with the required discharge limits. Based on more accurate influent data, the plant also optimized chemical dosing, with the project reporting an estimated 10–15% reduction in chemical costs.

This is the first step in the control chain:
Wastewater Change → Continuous Measurement → Reliable Process Data
Using Monitoring Data to Judge Treatment Status
The purpose of collecting data is not simply to display pH or COD values.
When sensors are installed at critical treatment points, operators can compare influent conditions with treatment-stage and final-effluent data. This provides a faster indication of whether the treatment process is responding correctly.
The textile dyeing plant demonstrates this in a more challenging wastewater environment.
Its wastewater was characterized by high color, high COD, salinity, strong pH fluctuations and difficult-to-degrade organic compounds. Dye residues and corrosive conditions also increased the risk of sensor contamination and measurement instability.
To address this, the project used corrosion-resistant, anti-fouling monitoring equipment and installed monitoring points at the equalization tank, biological treatment stage and discharge outlet.

Influent Data → Treatment-Stage Data → Effluent Data → Treatment Status
This multi-point structure allows operators to see not only whether the final discharge is acceptable, but also where treatment performance is changing.
From Data to Dosing and Oxidation Adjustment
This is where industrial wastewater quality monitoring becomes part of process control.
At the cement plant, more accurate influent data provided a basis for chemical dosing adjustment. Instead of relying only on fixed dosing or delayed sampling results, operators could respond to actual wastewater conditions.
At the textile dyeing plant, real-time monitoring data was linked with the dosing system and advanced oxidation equipment. pH and COD changes could therefore be used to support adjustments to coagulant dosing and oxidant consumption.
According to the project results, this control approach reduced coagulant consumption by 25% and oxidant consumption by 20%, with reported annual chemical-cost savings of more than RMB 500,000.

The operating logic is straightforward:
Detect Change → Assess Treatment → Adjust Dosing / Oxidation → Verify Effluent
The Result: Better Control Before Final Discharge
The two projects use different treatment processes, but the monitoring objective is the same: control wastewater treatment before problems appear at the final discharge point.
For the cement plant, the project reported continuous compliance of monitored pH, COD and ammonia nitrogen parameters, together with an estimated 10–15% reduction in chemical costs.
For the textile dyeing plant, the reported results included more than 95% color removal, effluent COD maintained below 50 mg/L, and a reduction of more than 15 tonnes of organic pollutant discharge per year. The project also reported lower chemical consumption after dosing and oxidation optimization.
These results connect the complete industrial wastewater monitoring chain:
Continuous Wastewater Data
↓
Treatment Status Assessment
↓
Dosing / Oxidation Adjustment
↓
Final Effluent Control
The specific monitoring parameters, sensor materials, cleaning method and installation points should still be selected according to the wastewater composition and treatment process of each industrial WWTP.
Need an Industrial Wastewater Monitoring Solution?
Need an Industrial Wastewater Monitoring Solution?
Build an online monitoring system around your wastewater characteristics, treatment process and required control points.
Request a Quotation
Send your monitoring parameters, measurement points, project location and communication requirements.
Request a QuotationSend Wastewater Data for Design
Provide pH, COD, ammonia nitrogen, wastewater composition, concentration ranges and treatment-process information.
View Multiparameter Monitoring →Contact for Engineering Solution
Discuss sensor selection, monitoring points, anti-fouling requirements, dosing control and oxidation integration.
Contact APURE Engineering →