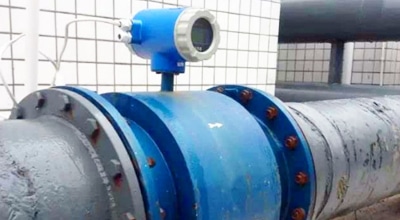
Multiparameter Monitor
Multiparameter water-quality monitoring combines measurements from several sensors or analytical channels to provide complementary information about physical, chemical and operational conditions at a specific monitoring point and time. Each parameter measures a different property. Combining them can make a process change or environmental event easier to investigate, but it does not identify every contaminant, prove a cause or certify that water is safe.
The useful question is not “How many sensors can be installed?” It is “Which measurements support the monitoring objective, and can their location, timing, calibration and units support the intended decision?” A defensible system records the measurement method, units, sensor status, location, depth or sample path, timestamp and relevant operating context for each channel.
Core engineering limits
- More parameters do not automatically produce a more accurate conclusion.
- Correlation does not establish causation.
- The same timestamp does not guarantee identical sensor response timing.
- One monitoring point may not represent an entire river, lake, tank or process.
- Continuous online data does not replace every laboratory or regulatory analysis.
- Cloud or IoT connectivity improves data access; it does not improve the analytical accuracy of a sensor.
What does a multiparameter water-quality system measure?
It measures a defined set of individual properties; it does not measure one universal quantity called “overall water quality.” The selected measurements should answer a stated process, environmental or operational question.
| Parameter | What it primarily indicates | Useful context | What it cannot determine alone |
|---|---|---|---|
| Temperature | Thermal condition at the sensor location | DO solubility, biological/process rates, compensation and seasonal/diurnal patterns | Chemical or microbiological safety |
| pH | Acid-base condition/activity response under the method | Ammonia speciation, treatment reactions, corrosion/scale and biological process context | Total alkalinity, pollutant identity or water safety |
| ORP | Combined oxidation-reduction response at the electrode | Process-zone changes and redox context when compared with pH and known chemistry | The concentration of one specific oxidant, reductant or contaminant |
| Dissolved oxygen (DO) | Oxygen available in the water at the measurement point | Aeration, respiration, oxygen demand, stratification and aquatic/process conditions | Total pollution, pathogen safety or the cause of a low value |
| Conductivity / specific conductance | Ability of dissolved ions to carry electrical current | Ionic-strength trends, mixing, intrusion, dosing and treatment changes | Which ions are present, nonionic contaminants or universal TDS |
| Turbidity | Optical scattering by material in the sample under the instrument method | Clarification/filtration events, sediment disturbance and optical-channel context | A universal suspended-solids mass, particle identity or pathogen absence |
| COD | A method-defined chemical-oxygen-demand result or a separately identified optical estimate | Organic-load/process trends when the method and calibration are known | BOD, toxicity, biodegradability or pollutant identity |
| Ammonia/ammonium | NH3, NH4+, TAN or another stated nitrogen basis under the method | Nitrification, loading and aquatic-risk investigation with pH/temperature/process data | Toxic NH3 unless the reporting basis and equilibrium context are known |
| Nitrate/nitrite | A named nitrogen species under a defined method | Nitrification/denitrification and nutrient trends | Total nitrogen, ammonia or source attribution |
| Chlorophyll/algal-pigment channel | Method-specific optical/fluorescence response associated with a pigment | Algal trend/event screening with suitable field checks | Species identity, toxin concentration or bloom safety by itself |
The parameter authority pages explain the individual methods and limitations for conductivity/TDS, turbidity, COD, ammonia/ammonium, pH/ORP and dissolved oxygen.
Does monitoring more parameters always improve accuracy?
No. Additional channels can provide useful context, but they also add calibration, maintenance, timing and interpretation requirements. A poorly placed or fouled extra sensor can add noise or a misleading correlation rather than evidence.
Add a parameter when it has a defined role:
- it measures a property needed for the decision;
- the method and range fit the expected water matrix;
- the installation can produce a representative measurement;
- its response time and logging can be aligned with related data;
- calibration, verification and maintenance can be supported;
- there is a planned response to an abnormal or invalid value.
Do not add a channel only because a platform can accept it. Start with the monitoring objective, then specify the smallest defensible set of measurements and reference analyses.
How should multiple water-quality parameters be interpreted together?
Use combined measurements to generate and prioritize explanations, not to declare a diagnosis. The safe pattern is:
Observation → Possible interpretation → Additional checks
| Observation | Possible interpretation | Additional checks before action |
|---|---|---|
| DO falls while ammonia rises in a biological wastewater stage | May be consistent with increased load, insufficient aeration or impaired nitrification | Align timestamps; check pH, temperature, alkalinity, flow/loading, aeration, biomass/process condition, nitrite/nitrate and a matched reference result |
| Conductivity rises while turbidity does not | Dissolved ionic content may have increased without a corresponding optical-particle change | Verify temperature basis, units and calibration; check dosing, mixing, source-water change and targeted ions; do not infer the dissolved substance |
| pH and ORP change together | May indicate a process-zone, dosing or redox-condition change | Verify both electrodes, temperature and flow; review dosing/chemical inputs and targeted analyses; ORP does not identify one species |
| A COD indicator rises while DO falls | May support investigation of increased oxygen demand or organic loading | Identify laboratory vs optical COD, sample timing and matrix calibration; check flow, temperature, aeration, solids, BOD/TOC only where separately measured and relevant |
| Temperature rises while DO falls | Lower oxygen solubility may contribute, or biological/process demand may have changed | Check pressure, salinity, mixing/aeration, time of day, respiration/photosynthesis and sensor equilibration |
| Turbidity and several optical channels change together after cleaning | The event may be a real solids change or a common optical/fouling effect | Review maintenance flags, wiper status, bubbles, window condition and a reference sample before accepting the event |
These examples are engineering prompts. They are not universal causal rules or automated control logic for an APURE product.
Correlation is not causation in water-quality monitoring
Parameters can move together because they share a cause, because the sampling conditions changed or because several sensors share the same fault. A correlation is a reason to investigate, not proof that one parameter caused the other.
Common shared causes include:
- dilution or a change in source water;
- storm runoff or a process loading event;
- temperature or seasonal change;
- a new sampling location or depth;
- mixing, stratification or changing flow;
- chemical dosing or aeration;
- biofouling, sediment, scaling or a maintenance event;
- shared power, communication or timestamp problems.
Before interpreting a relationship, check whether the measurements were made at comparable locations and times, with valid calibration and sensor-health status. Then use targeted process information or a reference analysis to test the explanation.
Why can values with the same timestamp represent different response timing?
A common display timestamp can describe when values were logged, not when every sensor completed the same analytical response. Each channel can have a different sensor response, thermal-equilibration time, sample-transport delay, stabilization criterion, polling interval and averaging window.
| Timing element | Why it matters | What to document |
|---|---|---|
| Sensor response/stabilization | Electrodes, optical sensors and membrane sensors do not all stabilize at the same rate | Model/procedure, stability rule and maintenance state |
| Thermal equilibrium | Temperature affects several channels and compensations | Time allowed after a location or sample change |
| Sample transport | A remote flow cell can receive the sample minutes or hours after it leaves the source | Intake location, tubing volume, flow and calculated transit time |
| Polling/logging interval | A controller may read channels sequentially or on different schedules | Poll time, logger time and clock source |
| Averaging/filtering | One displayed value may average a different time window from another | Raw interval, averaging window and any smoothing |
| Laboratory sample time | A grab sample represents a separate collection event and may change during handling | Collection time, preservation, holding and analytical method |
For a rapid event, retain raw timestamps and sensor status rather than aligning data only by a rounded chart time. The USGS multiparameter field guide requires parameter readings to stabilize and notes that actual behavior depends on the model and field conditions. EPA source-water guidance also distinguishes direct immersion from flow-cell measurement delay.
Where should a multiparameter sensor be installed?
Install it where the measurement represents the decision—not simply where installation is easiest. A technically accurate sensor can still provide an unrepresentative process measurement if it is placed in the wrong location.
Review:
- monitoring objective and the process/water-body boundary;
- mixing, flow direction, residence time and short-circuiting;
- depth, stratification and changing water level;
- inlet, outlet and upstream/downstream relationships;
- aeration zones and direct chemical-dosing points;
- stagnant areas, eddies and dead zones;
- sediment disturbance, bubbles and debris;
- sunlight/temperature exposure and biological growth;
- access for safe cleaning, calibration and reference sampling;
- power, communication, security and retrieval requirements.
One sensor location represents the conditions at that point. A river cross-section, lake/reservoir or large tank may need profiles, multiple depths or multiple stations. For a flow-through system, confirm that sample extraction, tubing and flow do not materially change the measurand before it reaches the sensor.
Multiparameter sonde vs separate sensors vs station or buoy
No architecture is universally best. Select the arrangement that can make representative measurements and be maintained for the application.
| Architecture | Advantages | Limitations | Best suited for |
|---|---|---|---|
| Integrated sonde | Compact; co-located measurements; convenient profiling/deployment | Shared deployment conditions; port/payload limits; fouling and access; each sensor still needs its own procedure | Field profiling, compact in-situ stations and selected co-located parameters |
| Multiple separate online sensors | Each channel can use its preferred installation and service access | More mounting, wiring, power and synchronization work; locations may not be identical | Process stages with parameter-specific flow/installation needs |
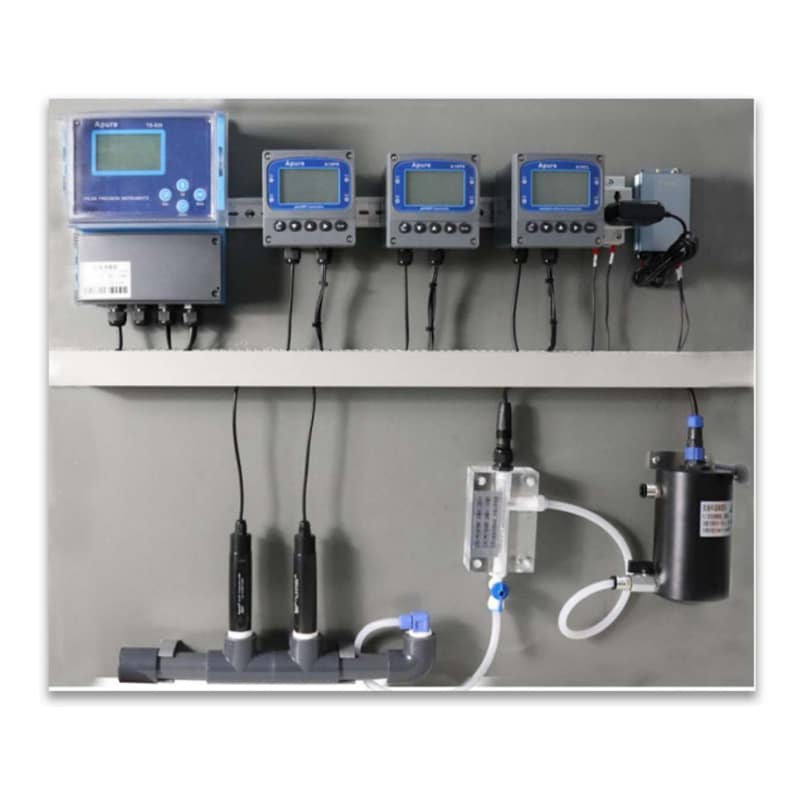
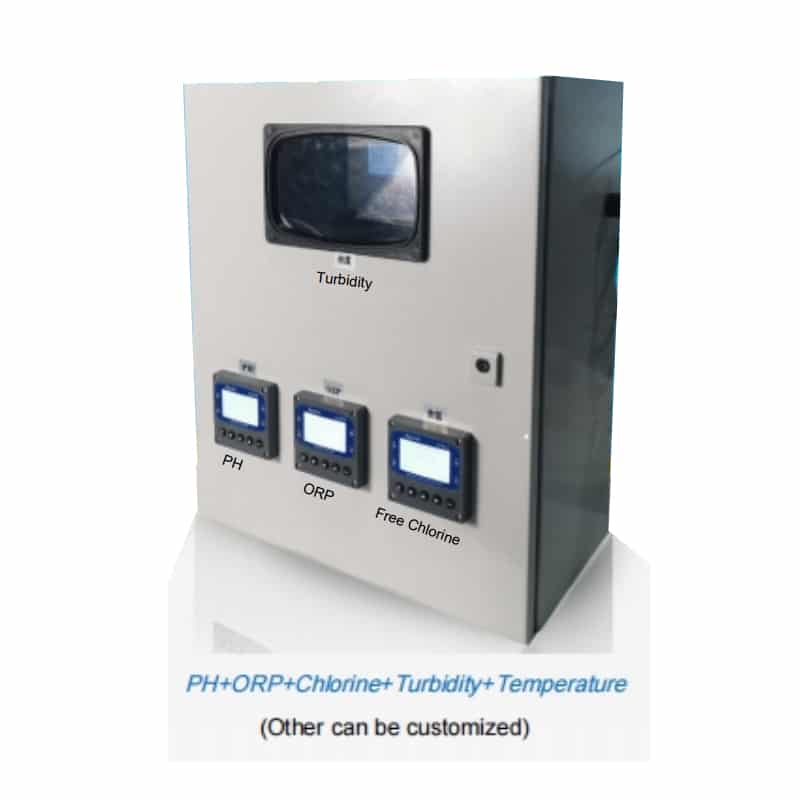
| Flow-through panel/cabinet | Controlled sample flow and accessible instruments; useful when sensors need a defined flow-cell environment | Pump/tubing delay, sample alteration, drainage and maintenance; sample must remain representative | Fixed process/source-water stations with engineered sample handling |
| Fixed in-situ station | Continuous data at a defined location; can integrate power, logging and telemetry | One-point representativeness; installation and service constraints | Rivers, tanks and processes where a fixed point is justified |
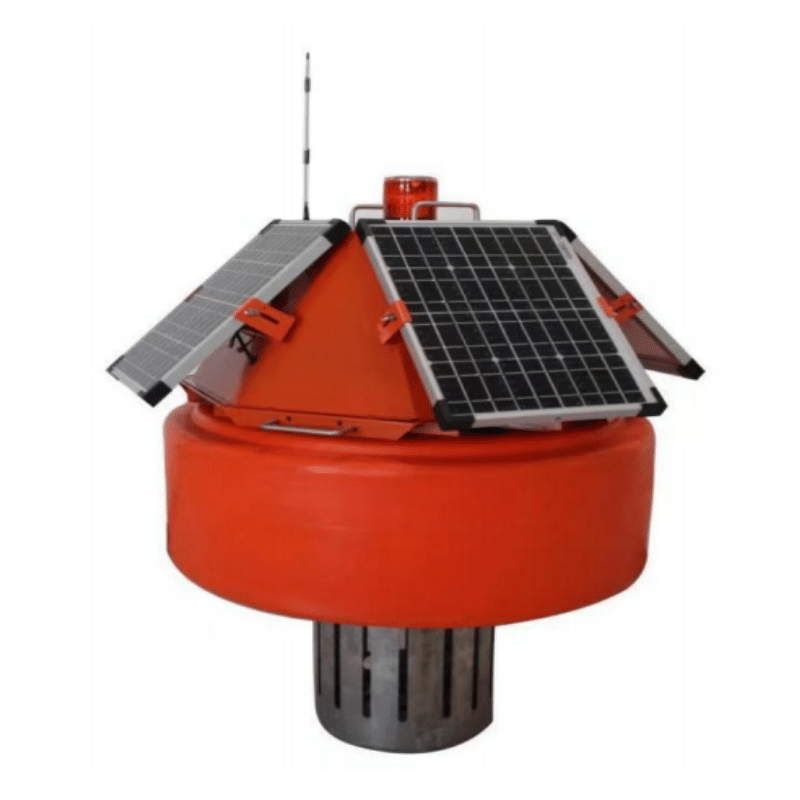
| Buoy station | Remote open-water platform; can support selected depths and telemetry | Mooring, weather, power, fouling, retrieval and depth-representativeness constraints | Lakes, reservoirs, rivers or marine sites with a verified deployment design |
| Portable multiparameter meter | Flexible spot checks and profiles; useful for verification and surveys | Operator-dependent; not continuous; each visit/time may represent different conditions | Field surveys, commissioning, troubleshooting and reference checks |
How should parameters be selected for an application?
Select parameters from the objective and process stage; do not copy one universal package. The following matrix is a starting framework, not a standard configuration.
| Monitoring objective | Possible primary parameters | Supporting context | Selection limitation |
|---|---|---|---|
| Wastewater biological process | DO, pH, temperature, ammonia/TAN basis appropriate to the method | Alkalinity, nitrite/nitrate, flow/load, COD/BOD/solids under defined methods | Influent, aeration basin and effluent need different locations and decisions; permits may require laboratory methods |
| River/surface-water condition | Temperature, pH, DO, conductivity, turbidity | Flow/water level, nutrients, pigments or targeted chemistry | Sites/depths must represent the objective; these channels do not identify every pollutant |
| Aquaculture | Temperature, DO, pH, salinity/conductivity where relevant | TAN/ammonia basis, nitrite, alkalinity and species/system information | Species, life stage, biomass, feeding, culture system and jurisdiction determine the plan |
| Drinking-water source | Source-specific field indicators such as temperature, pH, conductivity, turbidity and DO | Algae/pigment or targeted analytes where justified | Source-water screening is not final drinking-water compliance testing |
| Industrial process water | Parameters tied to corrosion, scaling, treatment or product requirements | Flow, pressure, temperature and targeted laboratory chemistry | The process and materials determine the measurement set; generic “water quality” is not enough |
| Irrigation | Salinity/conductivity and pH with source/crop/soil context | Sodium/ions, nutrients, suspended material and microbiology where relevant | A field sensor cannot replace crop-, soil- and jurisdiction-specific laboratory evaluation |
How should water-quality alarms be designed?
An alarm should represent a defined decision and account for normal site behavior, persistence and data validity. Do not copy a generic threshold to every site.
| Alarm type | Purpose | Design question |
|---|---|---|
| Warning threshold | Earlier attention before a critical condition | What action follows, and is the value method/site-specific? |
| Absolute threshold | Defined operating, permit or safety boundary | Is the analyte, unit, method, location and authority exactly matched? |
| Rate-of-change alarm | Detect a rapid departure from baseline | What normal process transitions or maintenance events create a similar change? |
| Persistence/duration condition | Separate a short spike from a sustained event | How many valid readings and what duration are required? |
| Multi-parameter alarm | Increase confidence when related channels change together | What alternative explanations and timing differences remain? |
| Sensor-health alarm | Flag flatline, range, calibration, communication or maintenance state | Should the value be marked invalid rather than treated as a process event? |
A single abnormal value can justify checking the sensor and process. Multiple related changes can justify stronger investigation. Neither automatically identifies the contaminant or cause. EPA online-monitoring guidance recommends basing thresholds on normal behavior at the monitoring location and recognizes rate-of-change and multivariable analysis as separate tools.
How can a system distinguish a process change from a sensor problem?
It can screen for inconsistent behavior, but cross-parameter logic cannot prove that a sensor has failed.
| Observation | Possible sensor/data issue | Verification |
|---|---|---|
| Impossible instantaneous step | Power/reset, range/scaling, bubble, cleaning or communication artifact | Review raw data, status, maintenance log, wiring and a reference reading |
| Prolonged flatline | Stuck value, communication substitution, fouling or genuinely stable process | Check live response, communications and an independent measurement |
| One parameter diverges from related process behavior | Sensor drift/fouling or a real selective event | Inspect/clean, verify with a standard/reference sample and review process inputs |
| Data gap or repeated value | Logger/network failure or invalid-data handling | Check device time, buffer, retry logic and missing-data flags |
| Calibration failure or slow stabilization | Standard, contamination, membrane/optics/reference condition or temperature | Repeat the approved check; service only under the sensor procedure |
Keep invalid or unverified data visibly flagged. Do not silently replace it with the last valid value and then interpret it as a real process condition.
Does a multiparameter system have one calibration schedule?
No. Each sensor has its own standards, conditioning, verification, cleaning and replacement requirements. A site maintenance plan should combine those separate procedures without converting them into one universal frequency.
| Parameter/technology | Main maintenance concern | Verification consideration |
|---|---|---|
| pH/ORP electrode | Reference junction, hydration, coating, drift and buffer contamination | Correct standards, temperature, slope/offset criteria and independent check |
| Conductivity cell | Cell fouling, bubbles, cell constant and temperature basis | Standard bracketing the working range; inspect full unit/reference temperature |
| Optical DO | Optical cap condition, fouling, bubbles and pressure/salinity settings | Approved air/water reference and setting review |
| Membrane DO | Membrane/electrolyte condition, flow/stirring, bubbles and fouling | Model-specific polarization/conditioning and reference check |
| Turbidity/optical solids | Window/wiper condition, scratches, bubbles, color/particle effects and settling | Method-appropriate standards and a clean-optics check |
| Ammonium/nitrate ISE | Membrane conditioning, reference system, competing ions and ionic strength | Correct analyte/reporting basis, standards and representative matrix check |
| Optical COD/pigment channels | Window fouling, optical interferences and matrix-specific calibration | Reference samples under the validated model/matrix |
| Flow-through sample system | Pump, tubing, flow, pressure, leaks, sediment and sample delay | Confirm representative sample and calculated transport time |
Record the before-service reading, cleaning performed, calibration/adjustment, after-service verification and any data period affected by fouling or drift.
Does automatic cleaning eliminate maintenance?
No. Cleaning can reduce fouling burden, but it does not eliminate inspection, calibration or replacement. Biofilm, sediment, scaling, oil/grease, scratches, membrane aging and reference-electrode problems affect technologies differently.
Confirm what is actually cleaned, how often the mechanism operates, whether it can damage the sensing surface and how its action appears in the data. A wiper on one optical window does not clean every sensor in a multiparameter assembly.
Online monitoring vs laboratory analysis
Online and laboratory measurements are complementary. Online systems provide high-frequency trends and event detection. Laboratory or specialized field methods provide targeted, method-defined or confirmatory results.
Differences can arise from:
- different analytes or reporting bases;
- optical estimate vs reference chemistry;
- unmatched collection and sensor timestamps;
- sample transport, preservation and holding time;
- heterogeneous water or settling solids;
- sensor fouling, calibration drift or matrix effects;
- laboratory preparation, method range and quality control.
Compare matched samples and keep each method separately identified. Do not average incompatible results or claim regulatory equivalence without explicit acceptance by the applicable authority.
Why can trends be more useful than one reading?
A trend shows baseline, rate of change, persistence and recurring cycles that a single value cannot show. Useful patterns include diurnal/seasonal variation, process cycles, storm events and repeated deviations after a maintenance or loading change.
Trends do not override a regulatory limit or validated analytical requirement. A stable trend can still be wrong if the sensor is biased, and a single valid exceedance may still require action under the applicable rule or process plan.
Which APURE multiparameter architecture should be considered?
Choose the architecture after defining the objective, parameters, sample conditions and maintenance plan.
| APURE page | Architecture role | Confirm before selection |
|---|---|---|
| KPS-400 | Compact integration of selected digital sensors | Ordered probes, port/channel map, direct/calculated values, ranges, interfaces, mounting and service access |
| KS-02 | Configurable panel with selected sensors/controllers and sample handling | Complete BOM, flow/pressure/temp, wetted materials, drainage, power, outputs and optional dosing boundary |
| KS-600 | Fixed cabinet/station arrangement | Cabinet layout/enclosure, instruments, sample system, power, data, ventilation and maintenance access |
| KSF-800 | Configurable buoy platform | Payload, sensor depths, power, logger, telemetry, mooring, environmental limits, retrieval and servicing |
These descriptions identify architecture only. They do not create a standard sensor configuration or performance specification.
Multiparameter monitoring design checklist
Objective and evidence
- What decision must the data support?
- Which parameters and reference analyses answer that question?
- What requirement names the method, unit, location and frequency?
Installation
- Is the point/depth representative under expected flow, mixing and water-level conditions?
- Are aeration, dosing, sediment, bubbles, sunlight and fouling controlled or documented?
- Can every sensor be safely cleaned, calibrated and replaced?
Data
- Are sensor, logger and platform clocks aligned?
- Are raw intervals, averaging windows, transport delay and invalid-data flags retained?
- Can the system distinguish no data, invalid data and a real zero?
Quality assurance
- Does each channel have its own current procedure, standards and acceptance criteria?
- Are matched field/laboratory checks planned?
- Are before/after-maintenance readings and corrections documented?
Alarms and response
- Is the alarm a warning, process limit, regulatory limit or sensor-health flag?
- Does it require persistence or corroboration?
- Who verifies the event, and what independent check follows?
Frequently asked questions
Can a multiparameter sensor determine overall water quality?
Not by itself. It provides complementary measurements at a defined point and time. It cannot identify every contaminant or replace all microbiological, chemical, toxicological or regulatory analyses.
Should all sensors be installed at the same point?
Only when that location and shared conditions suit every sensor and the monitoring objective. Some sensors need a flow cell, a different depth or protection from aeration, sediment, sunlight or dosing. Co-location can improve comparability but can also impose the wrong conditions on one channel.
Can high turbidity affect other sensors?
It can affect some optical paths, promote fouling or indicate a sample change, but the effect is model- and method-specific. Do not apply one universal turbidity correction to every optical or electrochemical sensor.
Can cloud or IoT connectivity improve measurement accuracy?
No. Connectivity can improve access, timestamping, alerts and maintenance visibility. Sensor accuracy still depends on the measurement method, calibration, installation, sample and instrument condition.
Can several abnormal parameters identify a pollutant?
They can narrow an investigation or increase confidence that conditions changed. They usually cannot identify a specific pollutant without targeted analysis and source/process evidence.
How often should a multiparameter system be calibrated?
There is no universal interval. Use each sensor’s current procedure, the monitoring program, site fouling/drift history, data-quality objective and verification results.
Does continuous monitoring determine compliance?
Only when the applicable authority explicitly accepts the instrument, method, location, QA and reporting procedure for that purpose. Otherwise it supports process control, screening or event detection and may trigger confirmatory analysis.
What should happen after one abnormal reading?
Check validity first: sensor status, calibration, fouling, bubbles, maintenance and timing. Review related process data and repeat or independently verify the result before assigning a cause, unless the applicable response plan requires immediate precautionary action.
Technical references
- USGS — Use of multiparameter instruments for routine field measurements
- USGS — Continuous water-quality monitor procedures
- EPA — Online Water Quality Monitoring in Distribution Systems
- EPA — Online Source Water Quality Monitoring
- EPA — Interactive Guide to Nonpoint Source Monitoring
- ISO 15839:2003 abstract
These references support general monitoring practice. They are not APURE product certification or regulatory-equivalence claims.
APURE systems and related controller paths
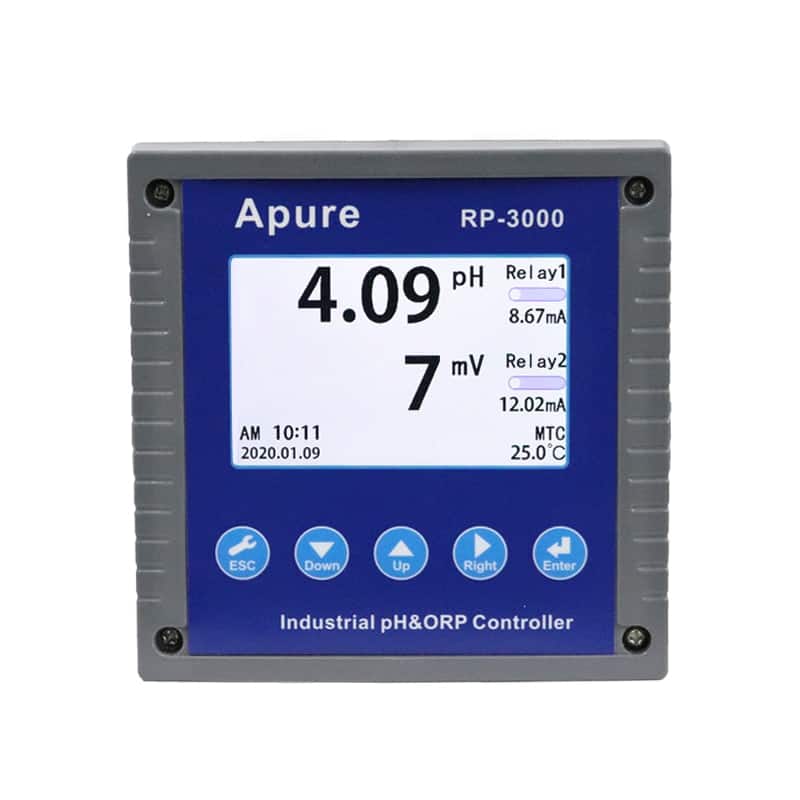
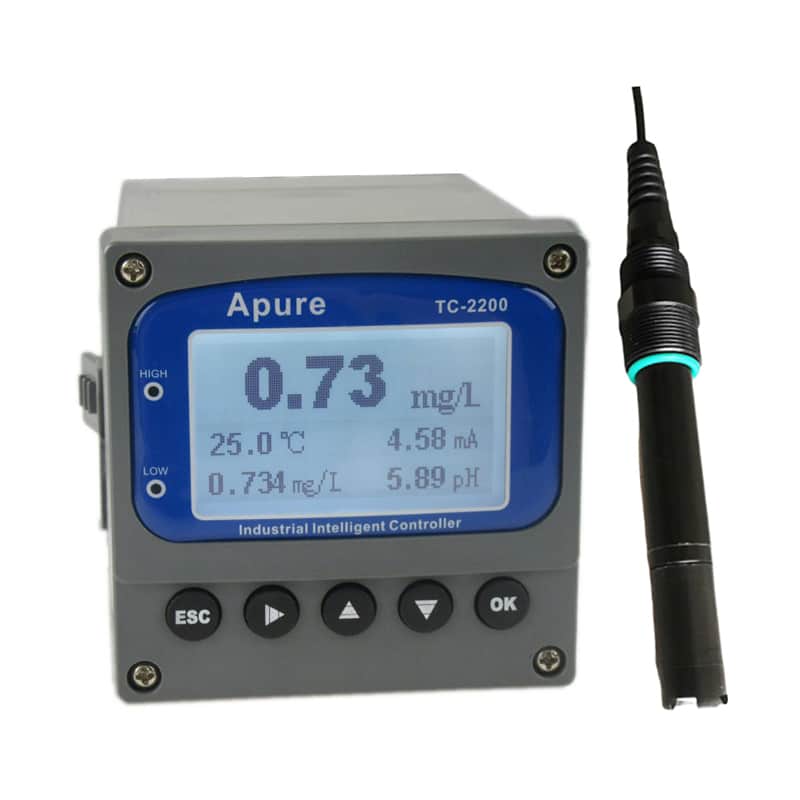
The multiparameter system pages below provide configuration paths for KPS-400, KS-02, KS-600 and KSF-800. RP-3000 and TC-2200 are related controller paths rather than universal multiparameter packages. Confirm the required parameter set, sensor combination, installation arrangement, interfaces and project documentation before selection.

Product categories
Related articles
3 Main Water Quality Parameters Types
Why is water quality important?
Solution of Water Pollution: 10 Practical Methods
What Is Municipal Water?
What is ORP?
Main water quality indicators
pH Sensors: Working Principle, Selection and Calibration
How To Remove Chlorine & Chloramine From Water?
What Is pH Probe and How It Works?
Dissolved Oxygen Probe How It Works?
Distilled Water vs Purified Water: What’s The Difference?
Ammonia vs Ammonium