
What are nitrates and why are they important?
Nitrate is a form of nitrogen that exists in several different forms in terrestrial and aquatic ecosystems. These forms of nitrogen include ammonia (NH3), nitrate (NO3) and nitrite (NO2). Nitrate is an essential plant nutrient, but in excess it can cause serious water quality problems. Along with phosphorus, excess nitrate accelerates eutrophication, leading to dramatic increases in aquatic plant growth and changes in the types of plants and animals living in streams. This in turn can affect dissolved oxygen, temperature and other indicators. Under certain conditions, excess nitrate can lead to hypoxia (low dissolved oxygen levels) and can be toxic to warm-blooded animals at higher concentrations (10 mg/L) or higher. Natural levels of ammonia or nitrate in surface water are usually low (less than 1 mg/L); it can range up to 30 mg/L in effluent from wastewater treatment plants.
Sources of nitrate include runoff from wastewater treatment plants, fertilized lawns and agricultural fields, failing on-site septic systems, runoff from animal manure storage areas, and industrial discharges containing corrosion inhibitors.
What are the health problems associated with nitrate in water quality?
Pregnant or nursing women and infants are especially vulnerable to nitrate-related health problems. Nitrates can interfere with the ability of an infant’s blood to carry oxygen at 6 months of age or younger. This is called “blue baby syndrome“. Infants may feel shortness of breath. Infants who receive formula mixed with well water with high nitrate concentrations may be at increased risk for this syndrome. people over 6 years of age are not usually at risk for this syndrome because their digestive systems naturally absorb and excrete nitrates.
Little is known about the long-term effects of drinking water with elevated nitrate levels. However, there are some studies that suggest nitrates may play a role in spontaneous abortions. In addition, water sources that show nitrate contamination may have other contaminants, such as bacteria and pesticides, which can enter groundwater with nitrates.
What is the drinking water standard for nitrates?
Nitrate levels up to 3 parts per million (ppm) are generally considered to be naturally occurring and safe to drink. The U.S. Environmental Protection Agency (USEPA) has set the primary drinking water standard for nitrate at 10 ppm. Significantly higher levels can be harmful to humans and livestock.
| Nitrate Level, ppm (parts per million) | Interpretation |
| 0 to 10 | Safe for humans and livestock. However, concentrations of more than 4 ppm are an indicator of possible pollution sources and could cause environmental problems. |
| 11 to 20 | Generally safe for human adults and livestock. Not safe for infants because their digestive systems cannot absorb and excrete nitrate. |
| 21 to 40 | Should not be used as a drinking water source but short-term use is acceptable for adults and all livestock unless food or feed sources are very high in nitrates. |
| 41 to 100 | Risky for adults and young livestock. Probably acceptable for mature livestock if feed is low in nitrates. |
| Over 100 | Should not be used as drinking water for humans or livestock. |
Sampling and equipment considerations
Nitrates from land-based sources end up in rivers and streams more quickly than other nutrients such as phosphorus. This is because they dissolve in water more readily than phosphate, which is attractive to soil particles. As a result, nitrates can be a better indicator of the potential for sources of sewage or manure pollution in dry weather.
Water contaminated with nitrogen-rich organic matter may show low nitrates. The decomposition of organic matter reduces the level of dissolved oxygen, which in turn slows the oxidation of ammonia to nitrite (NO2) and nitrate (NO3). In such cases, it may also be necessary to monitor nitrite or ammonia, which are much more toxic to aquatic organisms than nitrate.
Two nitrate detection methods are commonly used in monitoring programs: cadmium reduction and nitrate electrodes. The more commonly used cadmium reduction method produces a color reaction that is then measured by comparison with a color wheel or by using a spectrophotometer. Some programs also use a nitrate electrode, which can measure nitrate from 0 to 100 mg/L. Newer colorimetric immunoassay techniques for nitrate screening are now also available.
Cadmium reduction method
The cadmium reduction method is a colorimetric method that involves bringing nitrate in the sample into contact with cadmium particles to convert nitrate to nitrite. The nitrite then reacts with another reagent to form a red color whose intensity is proportional to the original amount of nitrate. The red color is then measured by comparison with a color wheel that increases in mg/L with increasing hue, or by measuring the amount of light absorbed by the treated sample at 543 using an electronic spectrophotometer – nanometer wavelength. The absorbance values were then converted to equivalent concentrations of nitrate by using a standard curve.
The curve should be created by the program consultant prior to each sampling run. The curve is plotted by making a set of standard concentrations of nitrate, causing them to react and produce the corresponding colors, and then plotting the absorbance values for each concentration against the concentration. Standard curves can also be generated for the color wheel.
The color wheel is only suitable for nitrate concentrations greater than 1 mg/L. For concentrations below 1 mg/L, a spectrophotometer should be used. Matching the color of a low concentration treated sample to a color wheel (or cube) can be very subjective and may lead to different results. However, color comparators can be effectively used to identify loci with high nitrate.
This method requires that the sample being processed is transparent. If the sample is cloudy, it should be filtered through a 0.45 micron filter. Be sure to test the filter for nitrate free. If the concentration of copper, iron or other metals exceeds a few mg/l, the reaction with cadmium will be slowed down and the reaction time will have to be increased.
The reagents used for this method are usually pre-packaged in different ranges depending on the expected concentration of nitrates in the stream. You should determine the appropriate range for the stream being monitored.
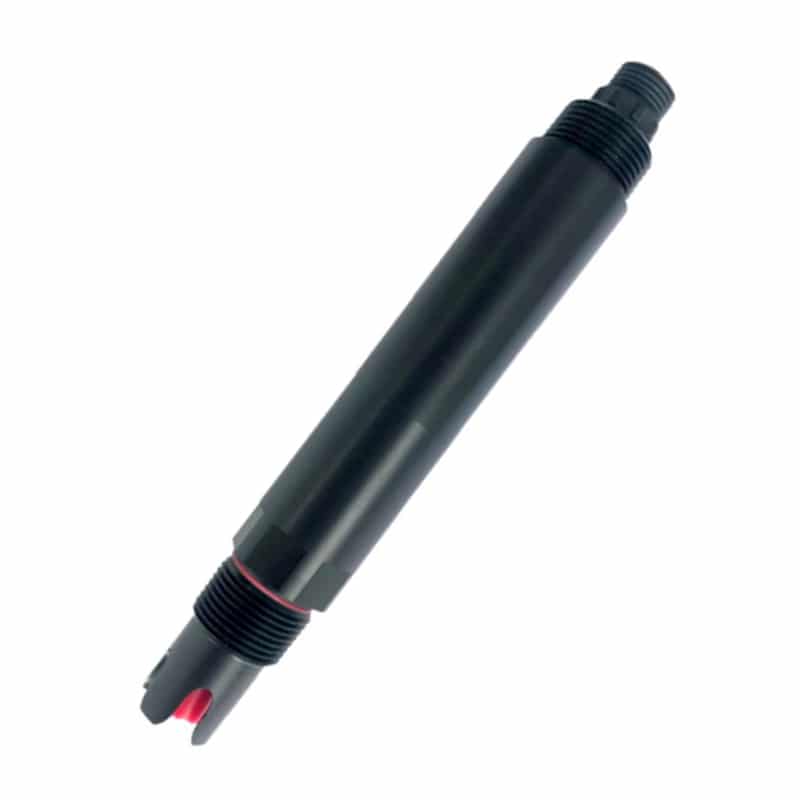
Nitrate sensor method
A nitrate sensor (used with a meter) is similar in function to a dissolved oxygen meter. It consists of a probe with a sensor that measures the nitrate activity in the water; this activity affects the electrical potential of the solution in the probe. This change is then transmitted to the meter, which converts the electrical signal into a scale in millivolts. The millivolts are then converted to mg/L of nitrate by a standard curve. the accuracy of the electrode can be affected by high concentrations of chloride or bicarbonate ions in the sample water. Fluctuating pH values can also affect the meter readings.
Nitrate electrodes and meters are expensive compared to field kits using the cadmium reduction method. (However, if a spectrophotometer is used instead of a color wheel, the cost is comparable.) A long cable to connect the probe to the meter is included. If the program has a pH meter that displays readings in millivolts, it can be used with a nitrate probe and does not require a separate nitrate meter. The results are read directly in mg/L.
While nitrate electrodes and spectrophotometers can be used in the field, they have certain drawbacks. They are more fragile than color comparators and are therefore more likely to be damaged in the field. They must be carefully maintained and must be calibrated before each sample run, or between samples if you are performing multiple tests. This means that samples are best tested in the lab. Note that samples tested with the nitrate electrode should be at room temperature, while the color comparator can be used in the field with samples at any temperature.
How to collect and analyze samples
The procedure for collecting and analyzing nitrate samples typically includes the following tasks.
Task 1 Prepare the sample container
If factory-sealed disposable bags are used for sampling, no preparation is required. Reused sample containers (and all glassware used in this procedure) must be cleaned before the first run and after each sample run according to standard methods. Remember to wear latex gloves.
Task 2 Prepare for travel to the sampling site
Detailed information regarding confirmation of sampling date and time, safety precautions, checking supplies, and checking weather and directions. In addition to standard sampling equipment and clothing, the following equipment will be required for nitrate nitrogen analysis in the field.
- Color comparator or field spectrophotometer with sample tubes (to read absorbance of samples)
- Reagent powder pillow (reagent to turn water red)
- Deionized or distilled water to rinse the sample tube between uses
- Wash bottles for holding rinse water
- Waste bottle with safety cap for used cadmium pellets, which should be clearly marked and returned to the laboratory where the cadmium will be properly disposed of
- Marked mixing container at the sample volume (usually 25 mL) to hold and mix the sample
- Clean, lint-free wipes for cleaning and drying sample tubes
Task 3 Collecting samples
For more information on collecting samples using screw cap bottles or bags
Task 4 Field analysis of samples
Cadmium reduction method with spectrophotometer
The following are general procedures for analyzing samples using the cadmium reduction method with a spectrophotometer. However, they should not supersede the manufacturer’s instructions if they differ from the steps provided below.
- Pour the first field sample into the cuvette cuvette and insert it into the spectrophotometer cuvette.
- Record the bottle number on the lab sheet.
- Place the cap on the cuvette. Read the absorbance or concentration of this sample and record it on the field data sheet.
- Pour the sample back into the waste bottle for disposal in the laboratory.
Cadmium reduction method using a color comparator
To analyze a sample using the Cadmium Reduction Method with Color Comparator, follow the manufacturer’s instructions and record the concentration on the field data sheet.
Task 5 Return samples and field data sheets to the laboratory for analysis
Samples sent to the laboratory for analysis must be tested for nitrate within 48 hours of collection. Keep samples in the dark and on ice or refrigerated.
Task 6 Determination of results in the laboratory (spectrophotometer absorbance or nitrate electrode)
Preparation of standard concentrations
Spectrophotometer method for cadmium reduction
First determine the range you will be testing in (low, medium or high). For each range, you will need to determine the lower limit, which will be determined by the detection limit of the spectrophotometer. The high end of the range will be the endpoint of the range you are using. Use a nitrate nitrogen standard solution that is appropriate for the range you are working in. 1-mg/L nitrate nitrogen (NO3-N) solution is suitable for low range (0 to 1.0 mg/L) testing. 100-mg/L standard solution is suitable for mid to high range testing. In the following example, assume that a set of standards in the 0 to 5.0 mg/L range is being prepared.
Example.
- Set up six 25 mL volumetric flasks (one for each standard). Label the flasks as 0.0, 1.0, 2.0, 3.0, 4.0, and 5.0.
- Pour 30 mL of the 25 mg/L nitrate nitrogen standard solution into a 50 mL beaker.
- Use a 1-, 2-, 3-, 4-, and 5-mL Class A volumetric pipette to transfer the appropriate volume of nitrate nitrogen standard solution to each 25-mL volumetric flask as follows
| Solution | Standard solutions |
| 0.0 | 0 |
| 1.0 | 1 |
| 2.0 | 2 |
| 3.0 | 3 |
| 4.0 | 4 |
| 5.0 | 5 |
Cadmium reduction method standard concentration analysis
Use the following procedure to analyze standard concentrations.
- Add the reagent powder pillow to the nitrate nitrogen standard concentration.
- Shake each tube vigorously for at least 3 minutes.
- For each tube, wait at least 10 minutes but not more than 20 minutes before continuing.
- Use the 0.0 standard concentration and “zero” the spectrophotometer according to the manufacturer’s instructions. Record the absorbance as “0” in the absorbance column of the lab sheet. Rinse the cuvette 3 times with distilled water.
- Read and record the absorbance at the 1.0-mg/L standard concentration.
- Rinse the cuvette 3 times with distilled or deionized water. Avoid contact with the lower portion of the cuvette. Wipe with a clean, lint-free wipe. Make sure the lower portion of the cuvette is clean and free of stains or water droplets.
- Repeat steps 3 and 4 for each standard.
- Prepare a calibration curve and convert the absorbance to mg/L as follows.
- (a) Make a vertical (y) axis and mark it as “absorbance”. Mark this axis in 1.0 increments starting from 0 up to the height allowed on the grid paper. (b) Make a horizontal (x) axis and label it “Concentration: mg/L as nitrate nitrogen”. Mark this axis with the standard concentrations: 0.0, 1.0, 2.0, 3.0, 4.0, and 5.0.
- Plot the absorbance of the standard concentration on the graph.
- Draw a “best fit” line through these points. This line should touch (or almost touch) each point. If not, the results of this procedure are invalid.
- For each sample, position the absorbance on the “y” axis, read the line horizontally, and then move down to read the nitrate nitrogen concentration in mg/L.
- Record the concentration on the lab worksheet in the appropriate column.
For nitric acid electrode
Standards were prepared using 100 and 10 mg/L as nitrate standard solutions for nitrate nitrogen (NO3-N). All references to concentrations and results in this procedure are expressed in mg/L, i.e., NO3-N. Eight standard concentrations will be prepared.
| 100.0 mg/L | 0.40 mg/L |
| 10.0 mg/L | 0.32 mg/L |
| 1.0 mg/L | 0.20 mg/L |
| 0.8 mg/L | 0.12 mg/L |
Use the following process.
- Set up 8 25 mL volumetric flasks (one for each standard). Label the flasks as 100.0, 10.0, 1.0, 0.8, 0.4, 0.32, 0.2, and 0.12.
- To prepare the 100.0-mg/L standard, pour 25 mL of the 100-mg/L nitrate standard solution into the flask labeled 100.0.
- To prepare a 10.0-mg/L standard, pour 25 mL of a 10-mg/L nitrate standard into a flask labeled 10.0.
- To prepare a 1.0-mg/L standard, add 2.5 mL of 10-mg/L nitrate standard solution to the flask labeled 1.0 using a 10- or 5-mL pipette. Fill the flask to the fill line with 22.5 mL of distilled deionized water. Rinse the pipette with deionized water.
- To prepare the 0.8-mg/L standard, add 2 mL of the 10-mg/L nitrate standard solution to the flask labeled 0.8 using a 10- or 5-mL pipette or a 2-mL volumetric pipette. Fill the flask to the fill line with approximately 23 mL of distilled deionized water. Rinse the pipette with deionized water.6. To prepare the 0.4-mg/L standard, add 1 mL of the 10-mg/L nitrate standard solution to the flask labeled 0.4 using a 10- or 5-mL pipette or a 1-mL volumetric pipette. Fill the flask to the fill line with approximately 24 mL of distilled deionized water. Rinse the pipette with deionized water.
- To prepare 0.32-, 0.2-, and 0.12-mg/L standards, prepare a 25-mL volume of 1.0 mg/L standard solution according to step 4. Transfer to a beaker. Pipet the following volumes into appropriately labeled volumetric flasks.
- Standard mL Nitrate Nitrogen
- Solutions Standard solution
- 0.32 8
- 0.20 5
- 0.12 3 Fill each flask to the fill line. Rinse the pipette with deionized water.
Nitrate electrode standard concentration analysis
Use the following procedure to analyze standard concentrations.
- List the standard concentrations (100.0, 10.0, 1.0, 0.8, 0.4, 0.32, 0.2, and 0.12) under “Bottle Number” in the lab table.
- Prepare the calibration curve and convert to mg/L as follows.
- Plot absorbance or mV readings for 100, 10 and 1 mg/L standards on semi-logarithmic coordinate paper with the logarithmic (x) axis for concentration and the linear (y) axis for absorbance or millivolts (mV). For the nitrate electrode curve, a straight line with a slope of 58 × 3 mV/decade at 25 C should be produced. That is, the distance between the measured values of 10 and 100 mg/L standard solutions should not exceed 58 ± 3 mV.
- Plot the absorbance or mV readings of 1.0-, 0.8-, 0.4-, 0.32-, 0.2-, and 0.12-mg/L standards on semi-logarithmic coordinate paper with the concentration on the logarithmic (x) axis and the millivolts (mV ) on the linear (y) axis. For the nitrate electrode, the result here should be a curve, since the response of the electrode is not linear at these low concentrations.
- For the nitrate electrode, recalibrate the electrode several times a day by checking the mV readings for the 10-mg/L and 0.4-mg/L standards and adjusting the calibration control on the meter until the reading plotted on the calibration curve is displayed again.
More articles on other water quality parameters:
Ammonia in wastewater
Ammonia vs ammonium
Main water quality indicators
Solution of water pollution